
Using GSS
Using GSS is part of a free web series, GWB Online Academy, by Aqueous Solutions LLC.
What you need:
- GWB Essentials recommended
-
Input file:
 RiverWaters.gss
Download this unit to use in your courses:
- Lesson plan (.pdf)
- PowerPoint slides (.pptx)
Click on a file or right-click and select “Save link as…” to download.
Introduction
GSS is a spreadsheet program designed for geochemists. GSS datasheets hold the results of chemical analyses, as well as values calculated from those results. You create a datasheet by typing, pasting, or dragging analyses for your samples into GSS.
You can then convert units, create plots and diagrams, mix samples, compare replicate analyses and check standards, calculate speciation and saturation, and more. You can drag samples into the other GWB apps, and drag calculation results from the other apps into GSS.
Task 1: Convert units
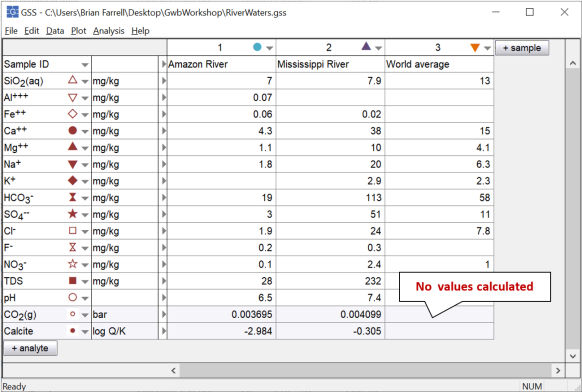
To get started, double-click on "RiverWaters.gss":
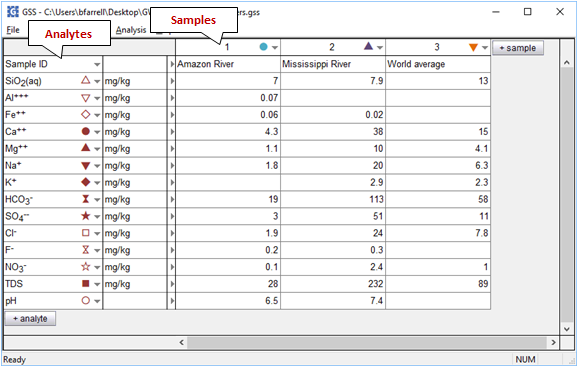
Analytes and their units are listed in the leftmost columns. Columns to the right hold data for the samples. You add analytes to the datasheet by clicking on the  button, and samples with the
  button. Exchange rows and columns by selecting Edit → Transpose Data Sheet.
To convert units, select one or more analytes
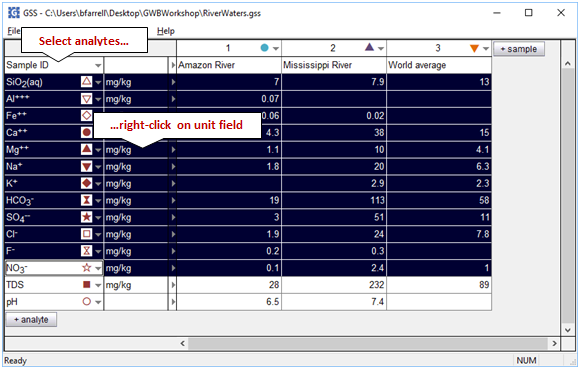
then right-click on the unit field and select a new unit under the Units pulldown.
To complete the task, select each of the chemical components listed with units of “mg/kg”, then click on Units → “mmol” → “mmol/kg”. When the program prompts
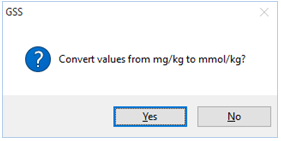
select Yes. The analyses for the components you selected should now appear in the new units. If you had selected No, the unit designation would have changed, but the numerical values would have remained unaltered.
Your results should look like this
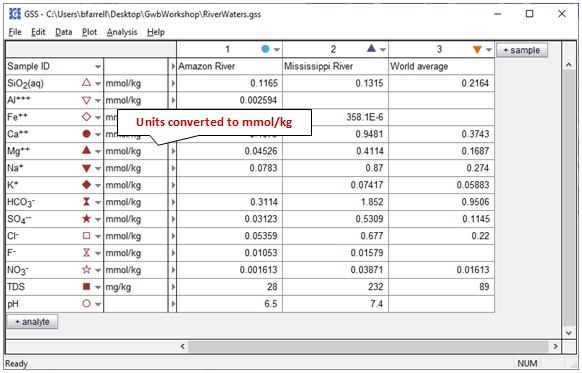
Why can't TDS (Total Dissolved Solids) be converted to mmol/kg like the chemical components?
Laboratories commonly report analyses in elemental equivalents, such as sulfate as mg/kg of sulfur, or bicarbonate as mg/kg of carbon. To specify such a unit in a GSS spreadsheet, choose the “SO4--” analyte, for example, right-click the units column, and select As → “S” rather than As → “SO4--”.
Try this out: Select the HCO3− and SO4-- analytes and convert them, respectively, to mg/kg of carbon and mg/kg of sulfur. Do your results make sense?
You can similarly set concentrations in species equivalents, in terms of protonated or deprotonated forms of the species in the spreadsheet, such as bicarbonate as mg/kg of carbon dioxide, or ammonium as mg/kg of ammonia. To specify such a unit, choose the “HCO3−” analyte, for example, right-click the units column, and select As → “CO2(aq)”.
Task 2: Create diagrams
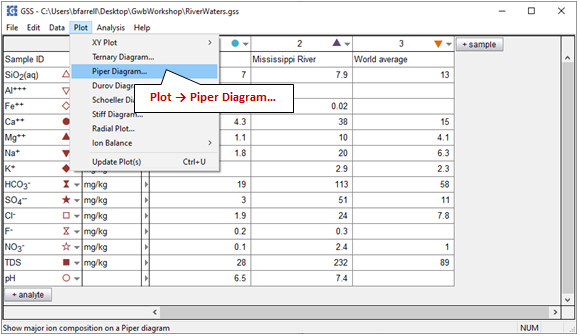
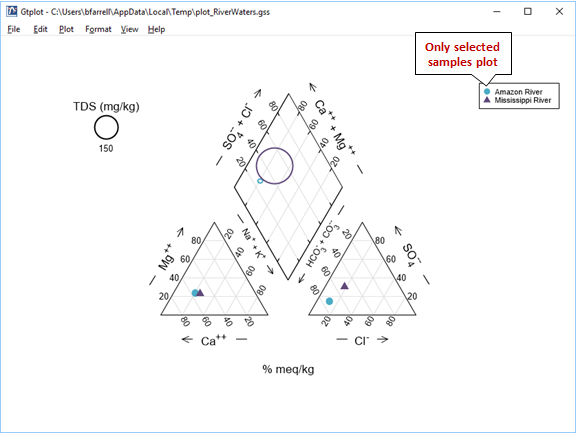
To plot a Piper diagram of the analyses in your datasheet, go to Plot → Piper Diagram...
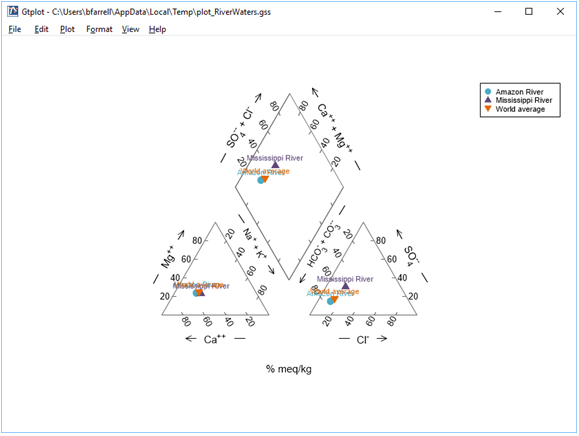
The Piper diagram is useful for portraying the major ion composition of a suite of samples. How does the Mississippi River sample differ from the others?
Right-click in various places on the plot—on the samples, labels, and axes—to explore how you can modify its appearance. You can turn sample legends and labels on or off, for example, and change the size, font, or color of text
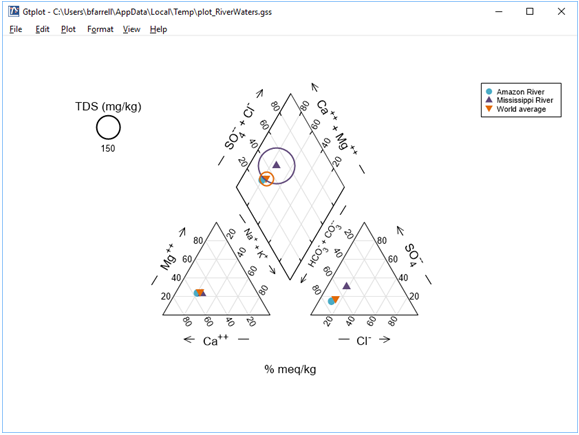
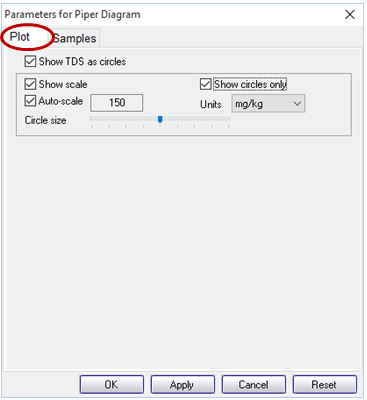
Move to the Parameters for Piper Diagram dialog that opened with your plot, or, if it's closed, double-click on the plot to open it. You control important aspects of the plot from the Plot pane, including representing the TDS content of your samples as circles of varying radii. Other plots, like Ternary, Schoeller, and Stiff diagrams, allow for more customization of the plot details
To plot only a subset of the samples in your datasheet, move to the Samples pane, and within the Available box select the sample or samples you would like to render, or click Select All. Click Apply to update your plot
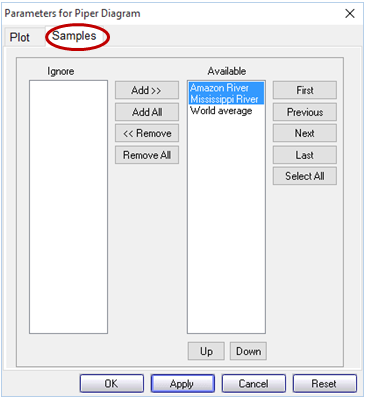
Each of the graphs you have launched from GSS will update to show only the samples you have selected
Take a moment to explore the other types of plots available in GSS under the Plot pulldown. Some types, like the Stiff diagram, Radial plot, Bar chart, and Pie chart, plot data for multiple samples side-by-side. Other types, like the cross, series, and time-series plots, as well as the Ternary, Durov, and Scheller diagrams, represent an arbitrary number of samples on a single set of axes.
Task 3: GSS as a geochemical calculator
GSS works with program SpecE8 to compute secondary values, such as mineral saturation and gas partial pressure, from the chemical analyses in a datasheet. The secondary values, known as “calculated analytes”, are added to your datasheet.
To add a calculated analyte, click on → Calculate with SpecE8…, and on the dialog that appears, choose, for the various variable types listed, one or more analytes to add.
To see how this works, launch the dialog and select “Chemical parameters” under “Variable type”. You should see a list of possible analytes under this rubric, including “Dissolved solids” (i.e., the TDS), “Ionic strength”, “Electrical conductivity”, “Charge imbalance error”, and “Water type”
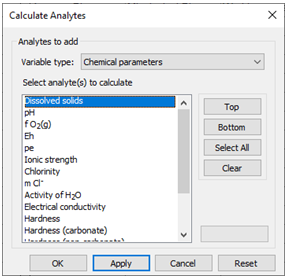
Choose a variable and click Apply.
Let's calculate the partial pressure of CO2(g) in our samples, as well as the saturation state of Calcite. Launch the dialog, and for “Variable type” choose “Gas partial pressure”. Then pick “CO2(g)” from the list
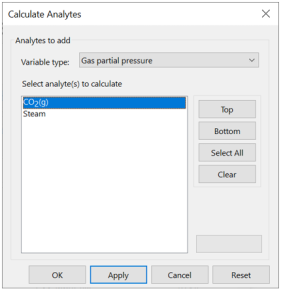
Click Apply. Now set “Variable type” to “Mineral saturation”, choose “Calcite” from the list, and once again click Apply. Can you explain why the program did not report values for the “World average” sample?
Before finishing up, look at the other variable types GSS can calculate. You can, for example, compute the concentration, activity, and activity coefficient of individual species.
Conversely, you can calculate the masses of components in the fluid when you have information about an individual species. Knowing pH, for example, you can use GSS to figure total mass of the H+ component for a suite of samples .
Task 4: Mix fluids
GSS can mix two or more samples together to create a new sample. In this task, we'll mix Amazon River water with water from the Mississippi River, in a 1:2 ratio by mass.
Before starting the mixing, you can control details of how GSS (using SpecE8) performs its calculations by going to Analysis → Options…
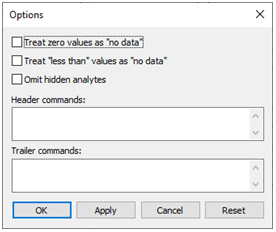
For example, you can tell the program what to do if it encounters 0 or “less than” values. Click OK.
To get started, go to Analysis → Mix Samples… to launch the SmartMix wizard. Select the samples to be mixed in the first step
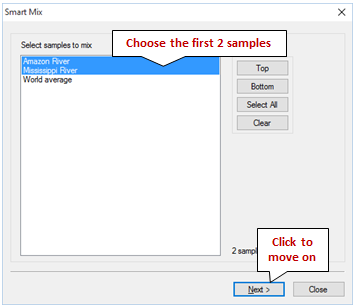
Choose the Amazon River and Mississippi River samples, then click Next.
GSS can mix samples in terms of volume or mass. The program mixes samples in equal proportions by default, but you can control the proportions by adding the “Mass solution” analyte to your spreadsheet or by setting the volume or mass of each sample directly within the wizard.
In our case, we'd like to mix 1 kg of Amazon River water with 2 kg of Mississippi River water. To do so, choose “mass” under “Mix by” then uncheck “equal proportions”. Leave the Amazon River sample at its default value of 1 kg, then select the Mississippi River sample, enter 2 in the field to the left of “kg”, and click Apply.
The wizard should look like this
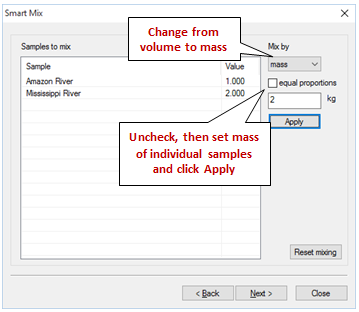
Click Next to move on to the next step of the wizard.
GSS sends each sample to SpecE8 to determine its bulk composition, then reports “success” or “failure” for each, as shown below
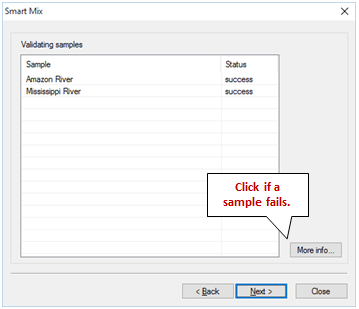
If a sample's status is listed as “failure”, you should click “More info…” to investigate why the sample failed to converge. Close the wizard and verify the input for each failed sample, or leave the failed sample out of the mixing calculation when relaunching the wizard.
If all the samples' statuses are listed as “success”, click Next to move to the final step of the wizard.
Check “Save as sample”, then enter a name and select where to insert the sample within the spreadsheet. Finally, choose how GSS should report the extent of the mixture. Since we mixed 1 kg of Amazon water with 2 kg of Mississippi water, the mass of our mixture should be 3 kg. You can keep this value by selecting “total mass solution" or you can scale the sample to either 1 kg of solution or 1 kg of solvent
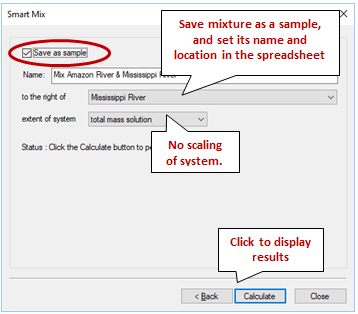
Click Calculate, then click Close to display your results.
GSS will show the results of the mixing as a new sample, as well as in a results pane, to the far right of the window:
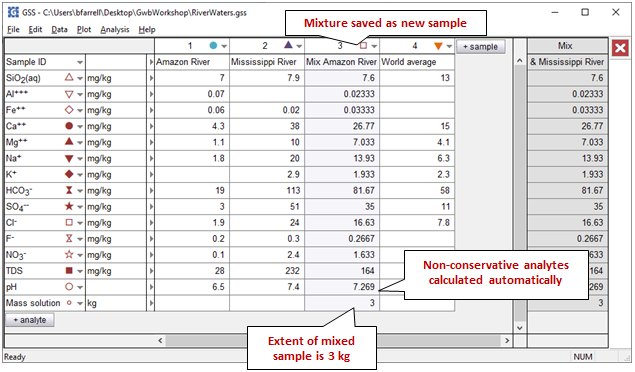
You may hide the results pane by clicking on the  .
.
The concentration of the various fluid components in the mixture is a weighted average of their values in the original fluid samples. Unlike in earlier versions of GSS, the values of non-conservative analytes like pH have been calculated automatically.
As an alternative to mixing fluids in GSS, you can simulate mixing processes and make “flash diagrams” using React. Navigate to the Fluid Mixing and Scaling topic to try it out for yourself.
Authors
Craig M. Bethke and Brian Farrell. © Copyright 2016–2026 Aqueous Solutions LLC. This lesson may be reproduced and modified freely to support any licensed use of The Geochemist's Workbench® software, provided that any derived materials acknowledge original authorship.
References
Bethke, C.M., B. Farrell, and M. Sharifi, 2026, The Geochemist's Workbench®, Release 18: GWB Essentials Guide. Aqueous Solutions LLC, Champaign, IL, 232 pp.
Hem, J.D., 1985, Study and interpretation of the chemical characteristics of natural water. US Geological Survey Water-Supply Paper 2254.
Comfortable with using GSS spreadsheets?
Move on to the next topic, Stability Diagrams, or return to the GWB Online Academy home.