
Diagrams, graphs, and plots
 GSS
GSS Act2
Act2 Tact
Tact React
React Phase2
 X1t
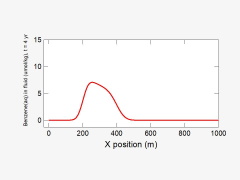
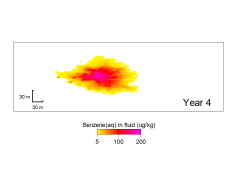
X1t X2t
X2tYou can use The Geochemist's Workbench® to render your GSS datasheets and modeling results in a broad variety of graphical formats. Create a diagram and copy and paste it into your document or illustration program. The GWB is compatible with software in common use, including MS Word, PowerPoint, and Excel, and Adobe Illustrator.
Browse the sections below to see a sampling of graphics generated with the GWB. Click on any diagram for a close-up view, or more information. Go to the movies page to see the results of X2t simulations animated with Xtplot and VSDC Free Video Editor.
If you have installed the GWB software, click on the icon shown underneath each diagram to download an input file pre-configured to calculate the diagram shown. (If two or more GWB icons appear, save all files to your desktop, then double-click on the first.)
)
)
)
)
)
)
)
)
)
)
)
)
of this GSS datasheet
 , unless noted.
GSS PowerPoint file:
)

)
)
)
)
)
)
)
)
)
)

)
)
)
)
)
)

)
)
)
)
)
)
)
)
)
)
)
)
)
)
)
)
)
)
)

)

)
)
)
)
)
)
)
)
)
)
)
)

)

)
)
)

)
)
)