Acidity and alkalinity
Acidity and Alkalinity is part of a free web series, GWB Online Academy, by Aqueous Solutions LLC.
What you need:
- GWB Standard recommended
-
Input files:
 Acidity.rea,
  Alkalinity.rea
Download this unit to use in your courses:
- Lesson plan (.pdf)
- PowerPoint slides (.pptx)
Click on a file or right-click and select “Save link as…” to download.
Introduction
Acidity is defined as the ability of a fluid to neutralize strong base. It is measured by titrating a fluid to an endpoint pH of ~8.3.
The acidity of a fluid is NOT the same as its pH.
Task 1: Water and carbonate acidity
Let's simulate an acidity titration. Locate file “Acidity.rea” and double-click on it. When React opens, look at the Basis pane

The pane contains the unreacted water, a Ca-HCO3 + Na-Cl water at pH 4.
Move to the Reactants pane

Here we've defined a reaction path in which we'll titrate 3 mmol of NaOH into the initial fluid.
On the Config → Options… dialog, the check box for mineral precipitation has been deselected

This will prevent minerals from forming as we trace the reaction path. To account for precipitation, we would select this option, or click Reset.
On Config → Output… set a suffix “_Ac”

The string will be appended to the names of your output datasets, so you can go back to examine the results without rerunning the model. Click OK.
Trace the simulation by selecting Run→ Go

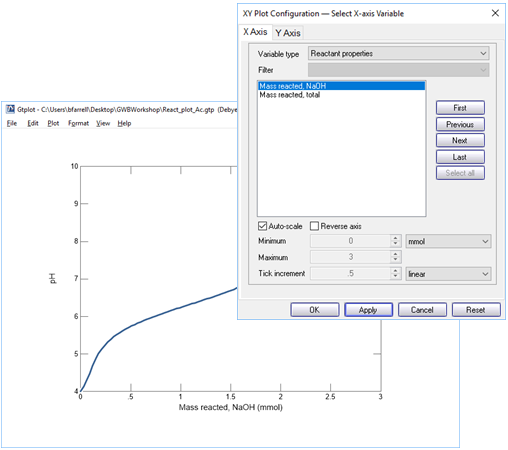
Click  to launch Gtplot and configure a diagram as indicated below

Your diagram should look like this

From your plot, what is the approximate acidity of the fluid? Take a titration endpoint pH of 8.3, and remember a mmol of NaOH is the same as a meq of base.
Now plot the concentrations of aqueous species in the fluid versus the amount of NaOH that's been added. On the XY Plot dialog, go to the Y Axis pane and select variable type “Species concentrations”. You can simplify the plot by right-clicking on a line and choosing “Hide This Line”.
Which aqueous species in the fluid account for its acidity?
Task 2: Mineral acidity
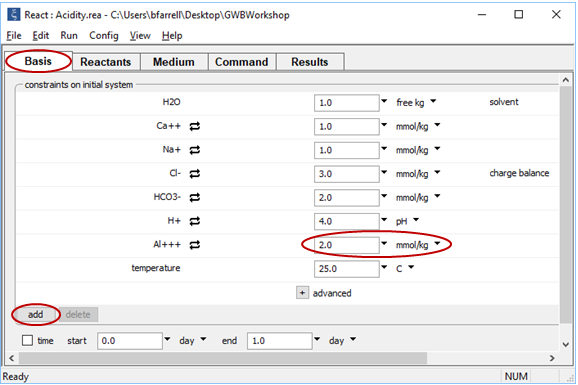
Return to React, or if you closed it, double-click on “Acidity.rea” once again. On the Basis pane, click  , then choose “Al+++” from the dropdown. Set the Al3+ concentration to 2 mmol kg−1. The pane should look like this

Go to the Reactants pane and change the mass of the NaOH titrant to 12 mmol

On Config → Output… set a suffix “_Ac+Al” and click OK

Now rerun the model, and when React finishes, launch Gtplot to render the results.
Compared to the first model, how has the acidity titration changed? If you like, you can compare instances of Gtplot side-by-side: Double-click on “React_plot_Ac.gtp” to render your earlier results.
Task 3: Water and carbonate alkalinity
Alkalinity is the ability of a fluid to neutralize strong acid. It is measured by titrating a fluid to an endpoint pH of ~4.5. It is expressed as meq acid kg−1, or as equivalent mg of CaCO3. To convert, 1 meq acid is equal to 50.05 mg CaCO3.
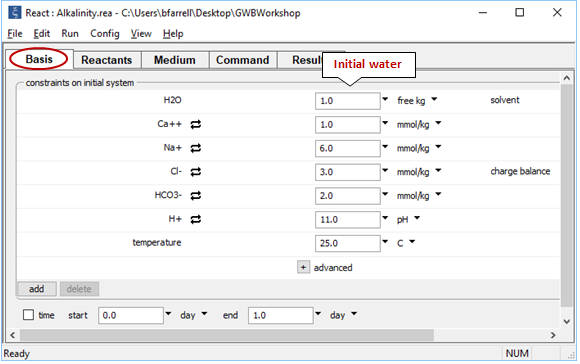
Open React and read in “Alkalinity.rea”. The Basis pane

contains the starting water, this time at pH 11. On the Reactants pane

we set up reaction with 6 mmol of strong acid, HCl.
On the Config → Options… dialog, the check box for mineral precipitation has been deselected

On Config → Output… set a suffix “_Alk” and click OK

Trace the simulation by selecting Run → Go. Launch Gtplot to diagram pH, carbonate alkalinity, and species' concentrations over the course of the titration. What is the alkalinity of this fluid? What reactions give rise to the alkalinity? How does alkalinity change as HCl is added?
Authors
Craig M. Bethke and Brian Farrell. © Copyright 2016–2026 Aqueous Solutions LLC. This lesson may be reproduced and modified freely to support any licensed use of The Geochemist's Workbench® software, provided that any derived materials acknowledge original authorship.
References
Bethke, C.M., 2022, Geochemical and Biogeochemical Reaction Modeling, 3rd ed. Cambridge University Press, New York, 520 pp.
Bethke, C.M., B. Farrell, and M. Sharifi, 2026, The Geochemist's Workbench®, Release 18: GWB Reaction Modeling Guide. Aqueous Solutions LLC, Champaign, IL, 219 pp.
Comfortable with acidity and alkalinity?
Move on to the next topic, Geothermometry, or return to the GWB Online Academy home.


